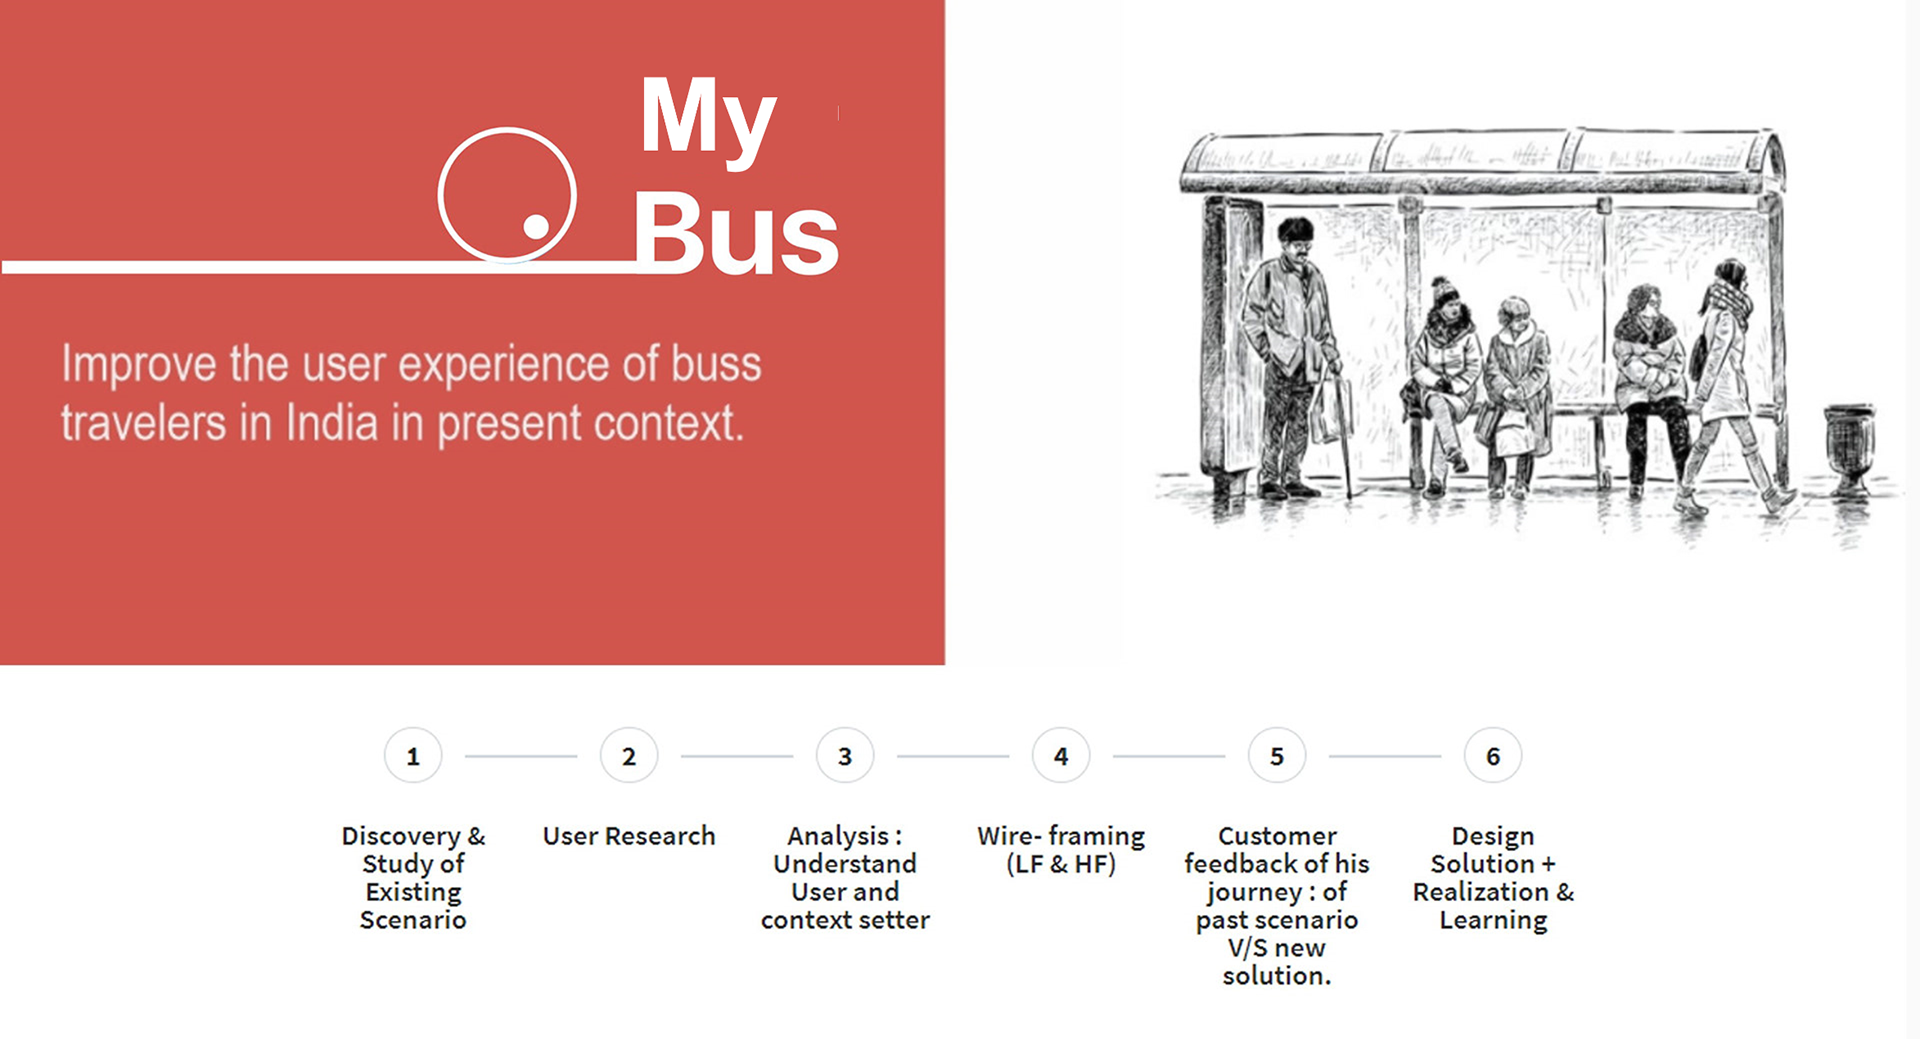
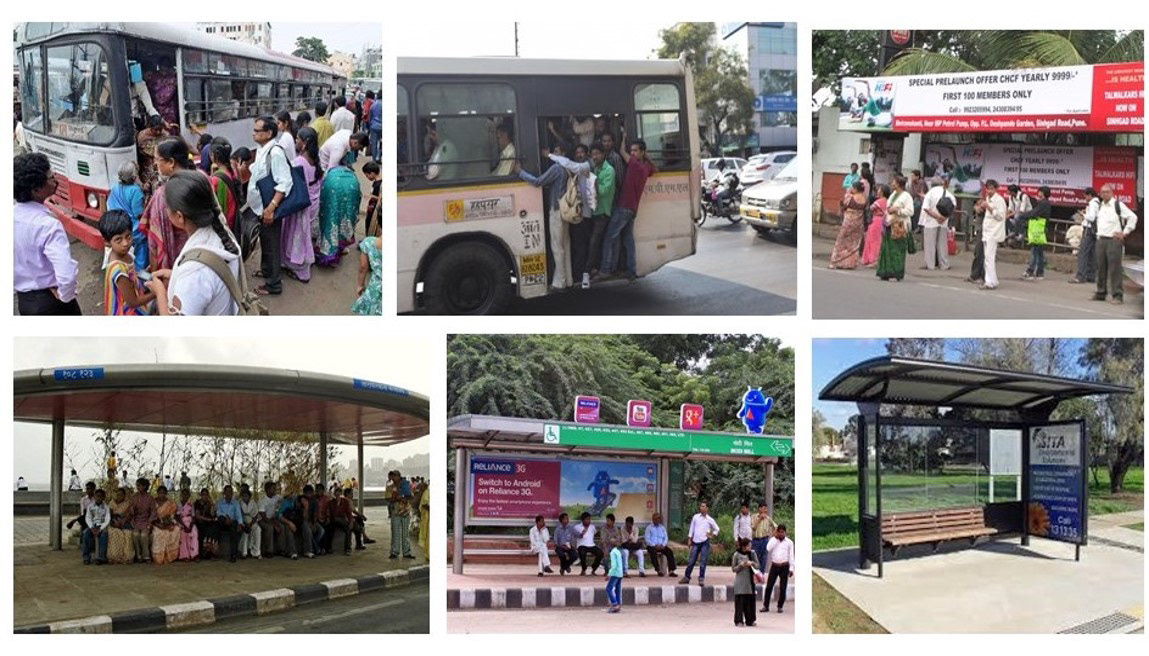
Existing Scenario in India for Buss Travel
The User's voice :-
I go to the bus stop and wait. Things on my mind – “Anxious of when will the bus reach my stop, will it be completely filled? Will I get a place to sit? Or even to stand?” And to add it up….what if I am not too sure about its route!!
Also, if this bus is completely filled, can I wait for another bus? I am not sure of the frequency, so I wont take a risk, and board a fully crowded bus”.
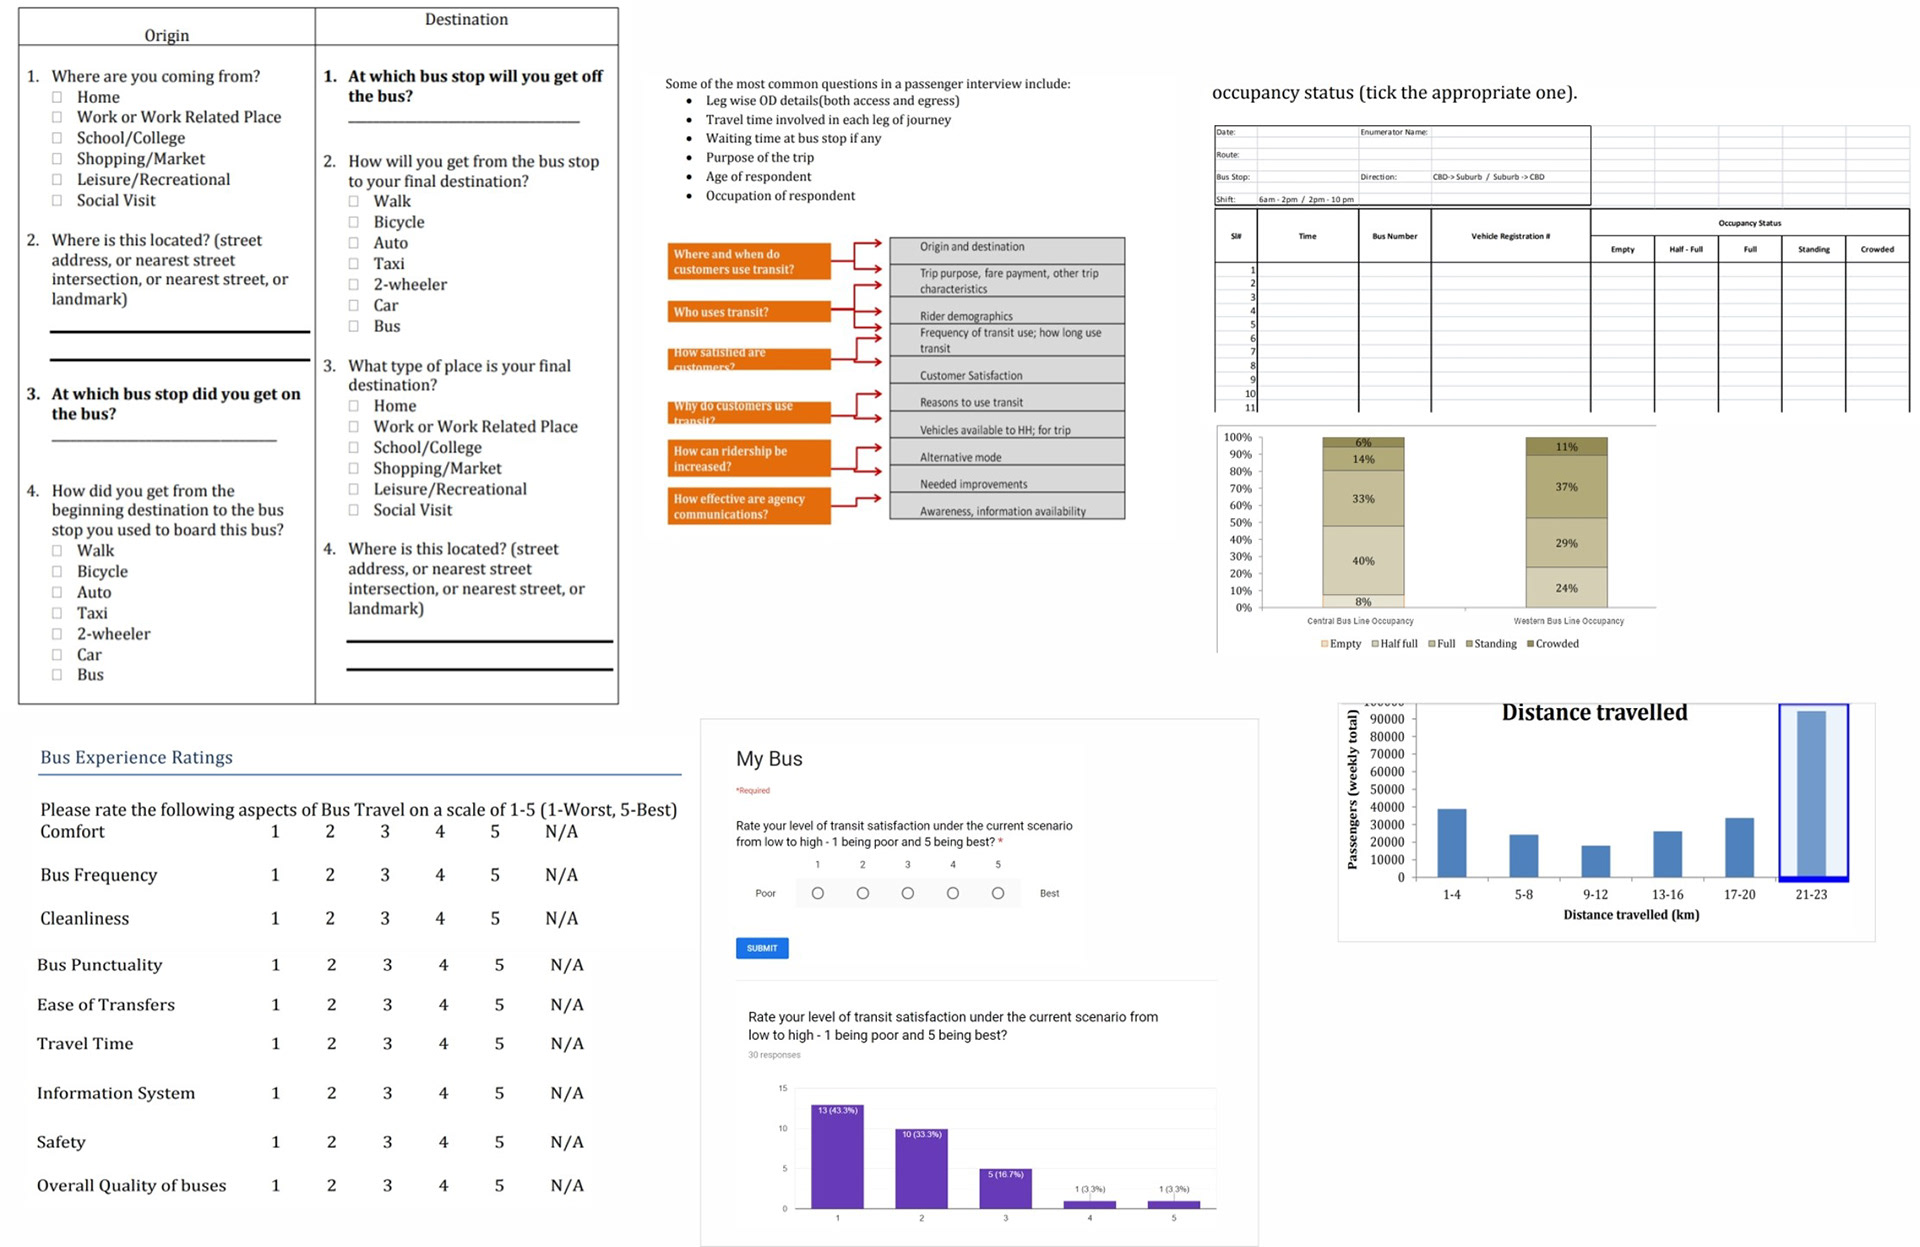
User Research Surveys
Before initiating the project, we gathered information from the existing users. We set up an online survey and asked them fill it out and also had on-site user observations and contextual inquiries.
The surveys were short on-site and mid-depth for remote online.
Online remote surveys of 30 users (10 train travelers and 20 bus travelers)?
It was realized that many users choose travel modes according to availability of transport, total time of travel, and proximity of start and endpoint in order. Its not just by mere proximity of travel points.
In this context, the most important aspect of the solution was to provide relevant information in sequential manner as per the priority of the requirement.
In this context, the most important aspect of the solution was to provide relevant information in sequential manner as per the priority of the requirement.
Research questions were like :-
•The satisfaction levels,
•Why bus/train/taxi,
•What was the priority for decision making
•Level of planning required before travel
•buffer time is taken for every transit.
•How the pain areas were managed in the current scenario by users.
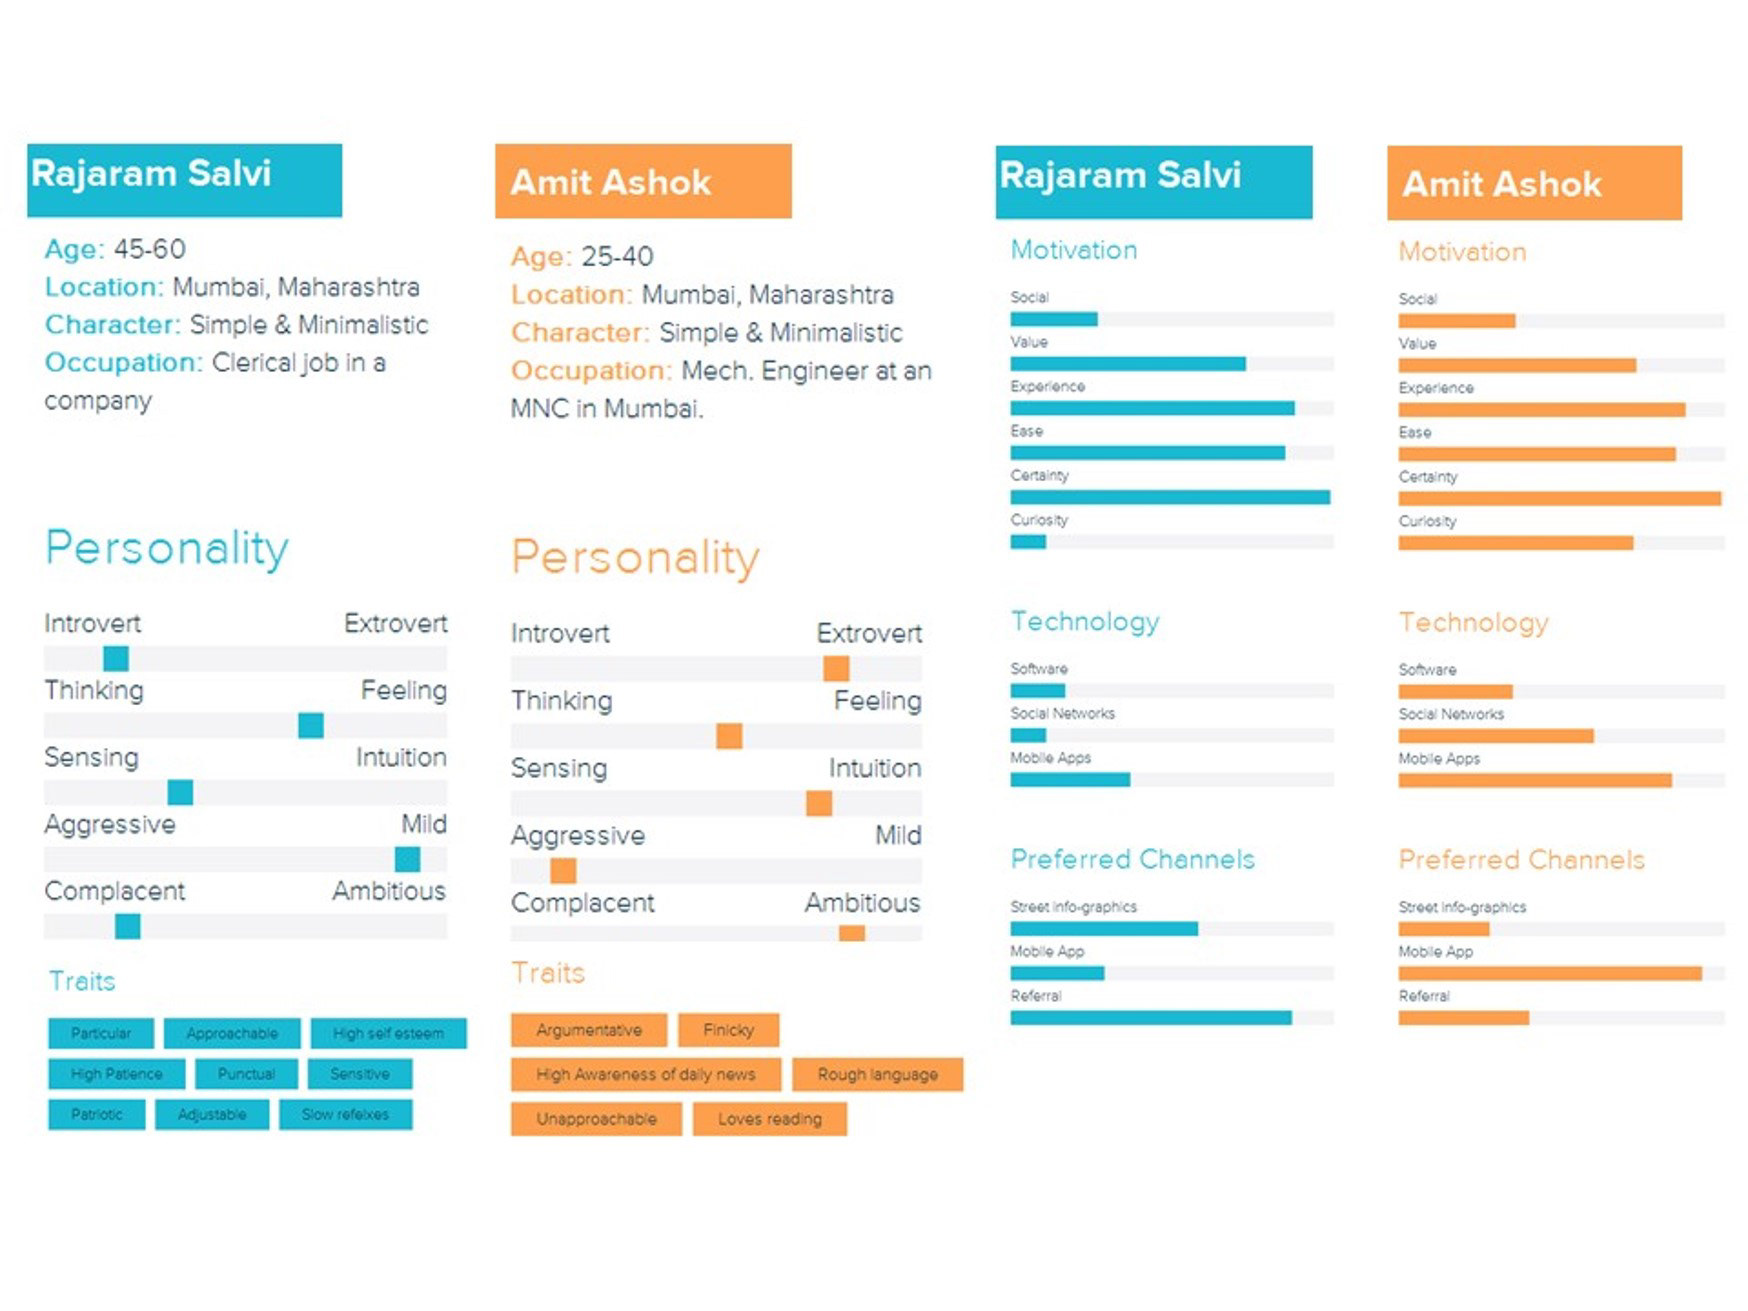
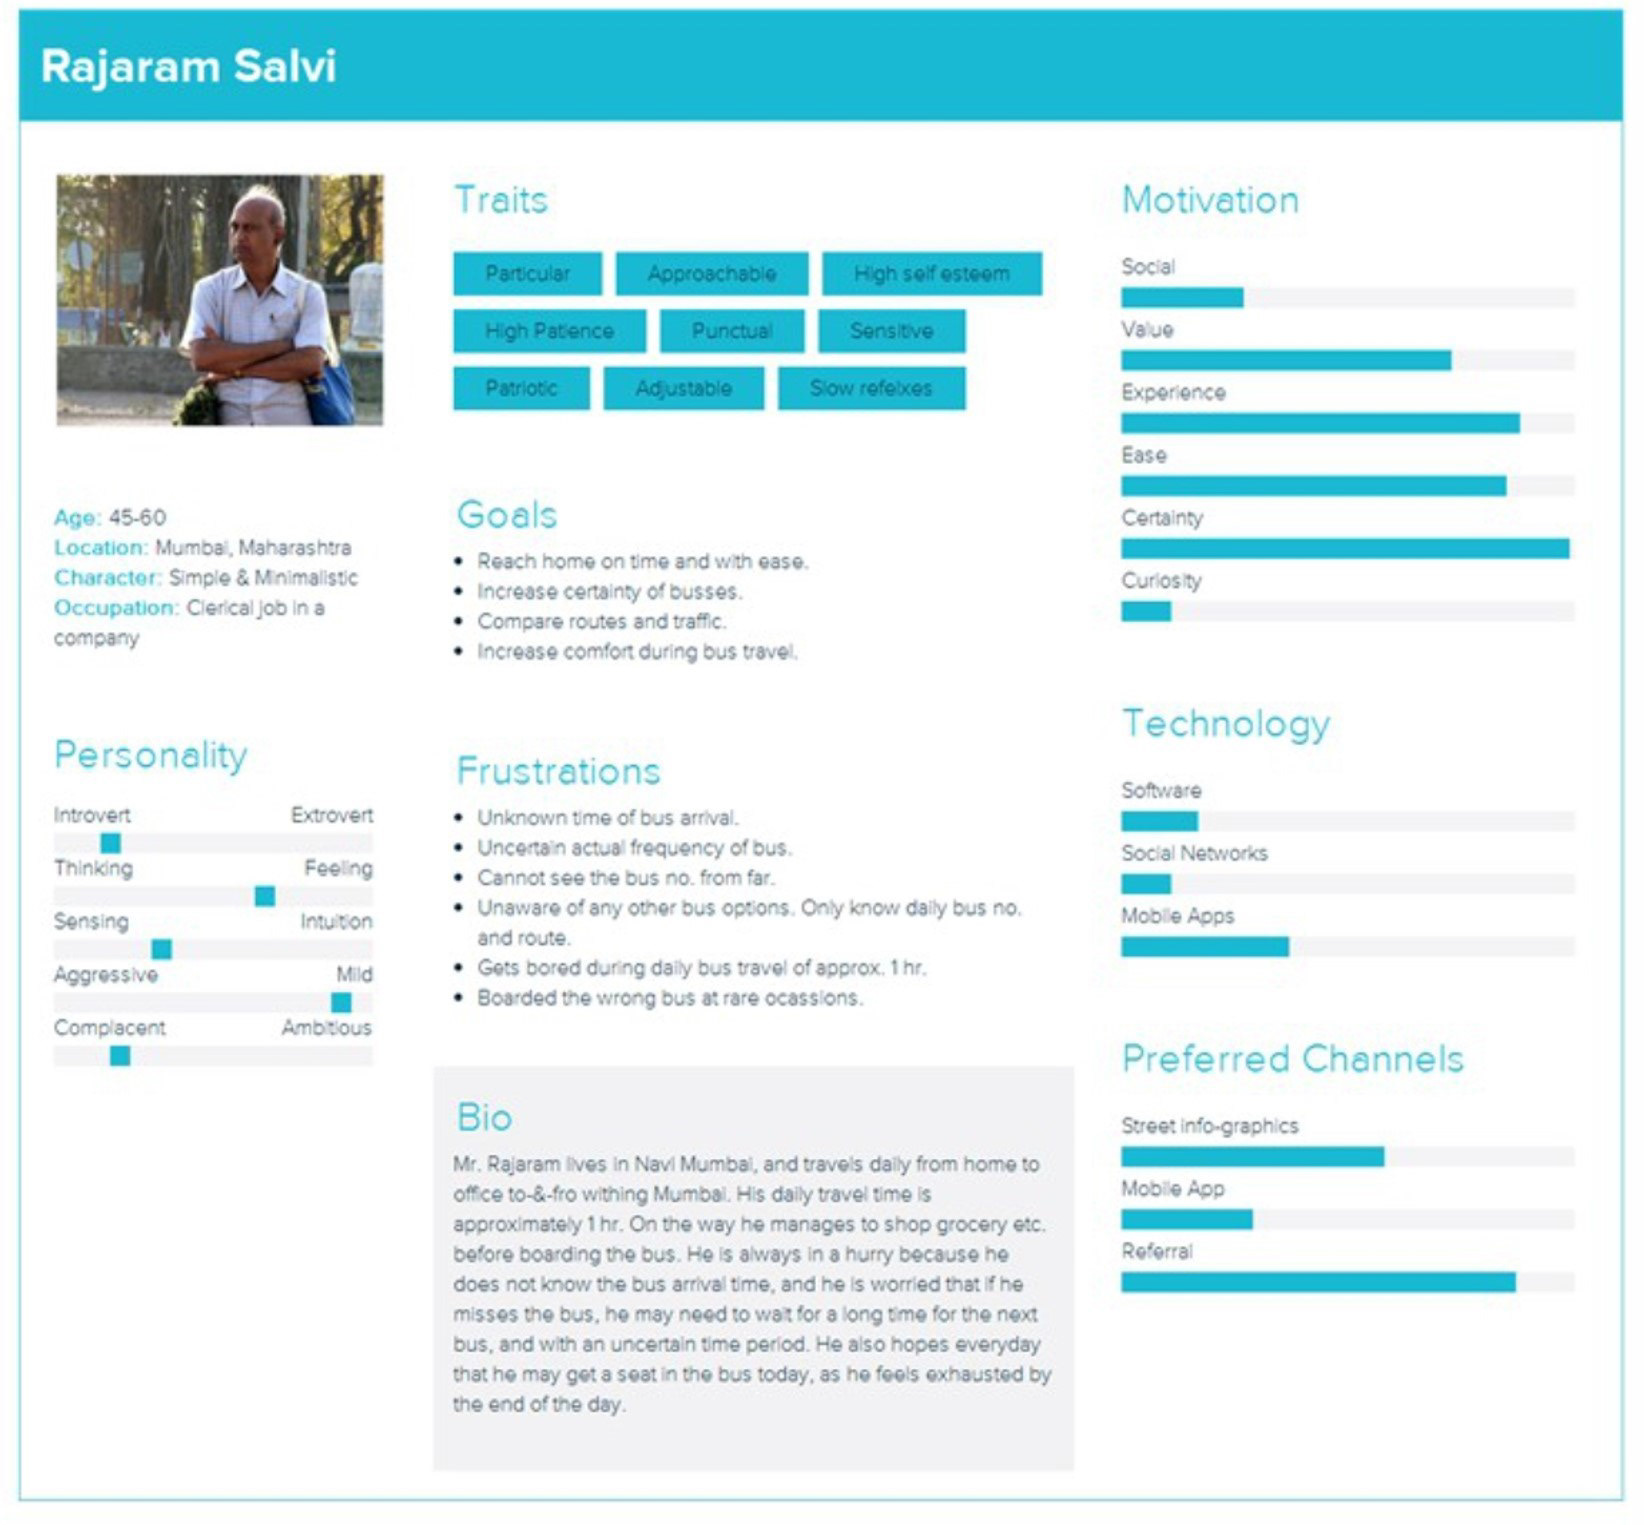
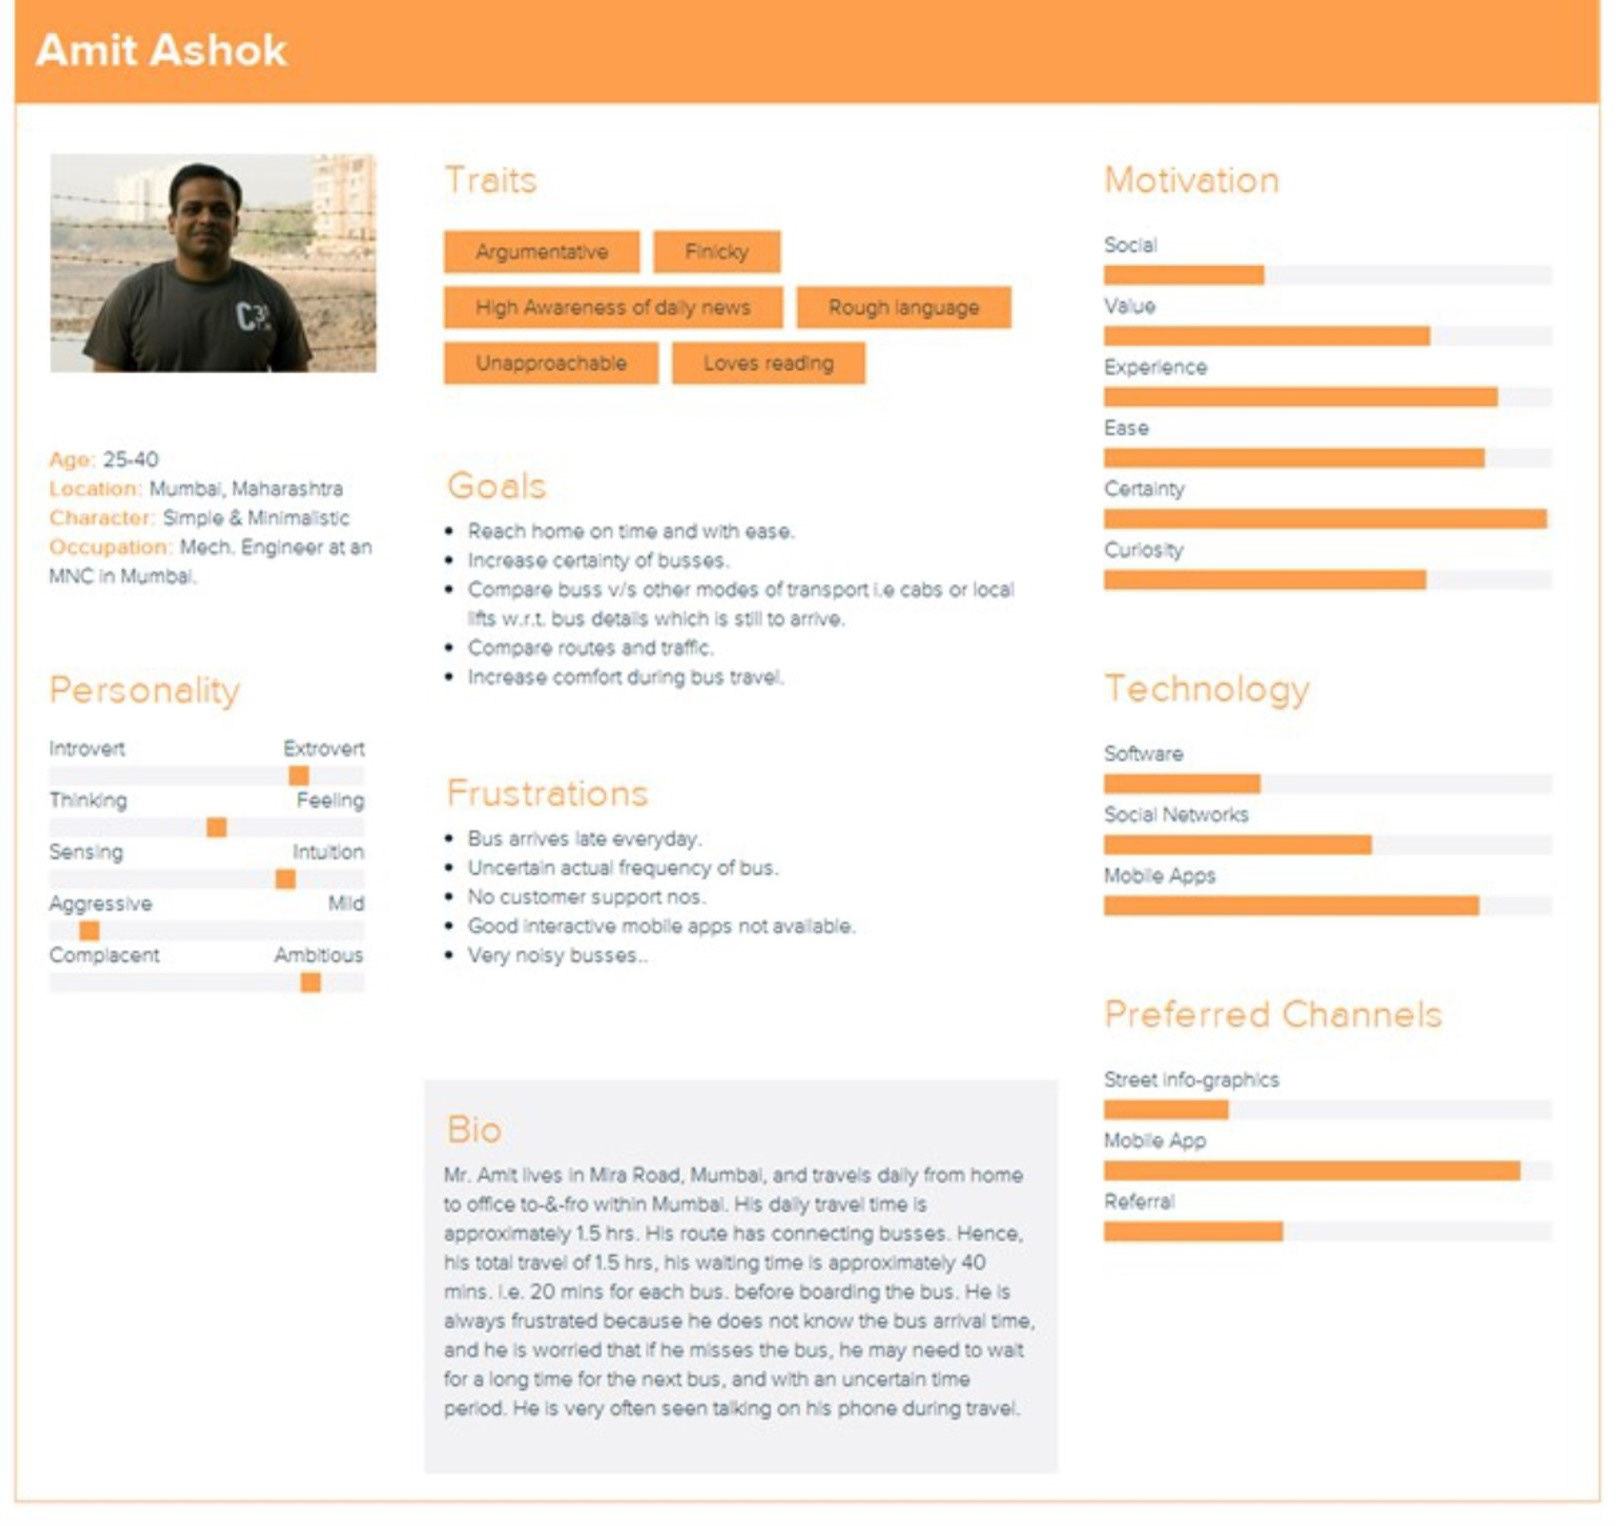
Personas
Based on the interviews and observations, I set up 2 personas. - 1 persona was developed through daily bus travelers, and the other persona was from people travelling only in trains (although bus as a mode was preferred by them, but choose train for various reasons), and those travelers who traveled by both - bus and train modes.
•Once the observations were gathered, and insights realized, there felt a need to have a persona as a guiding element for the rest of the project. The persona also helped us gain user feedback on the analysis.
•User research was the primary feed to develop the personas. The results from the survey (on-site and remote) came in distinct commonalities which enabled us to develop clusters of information, and hence 2 typical personas.
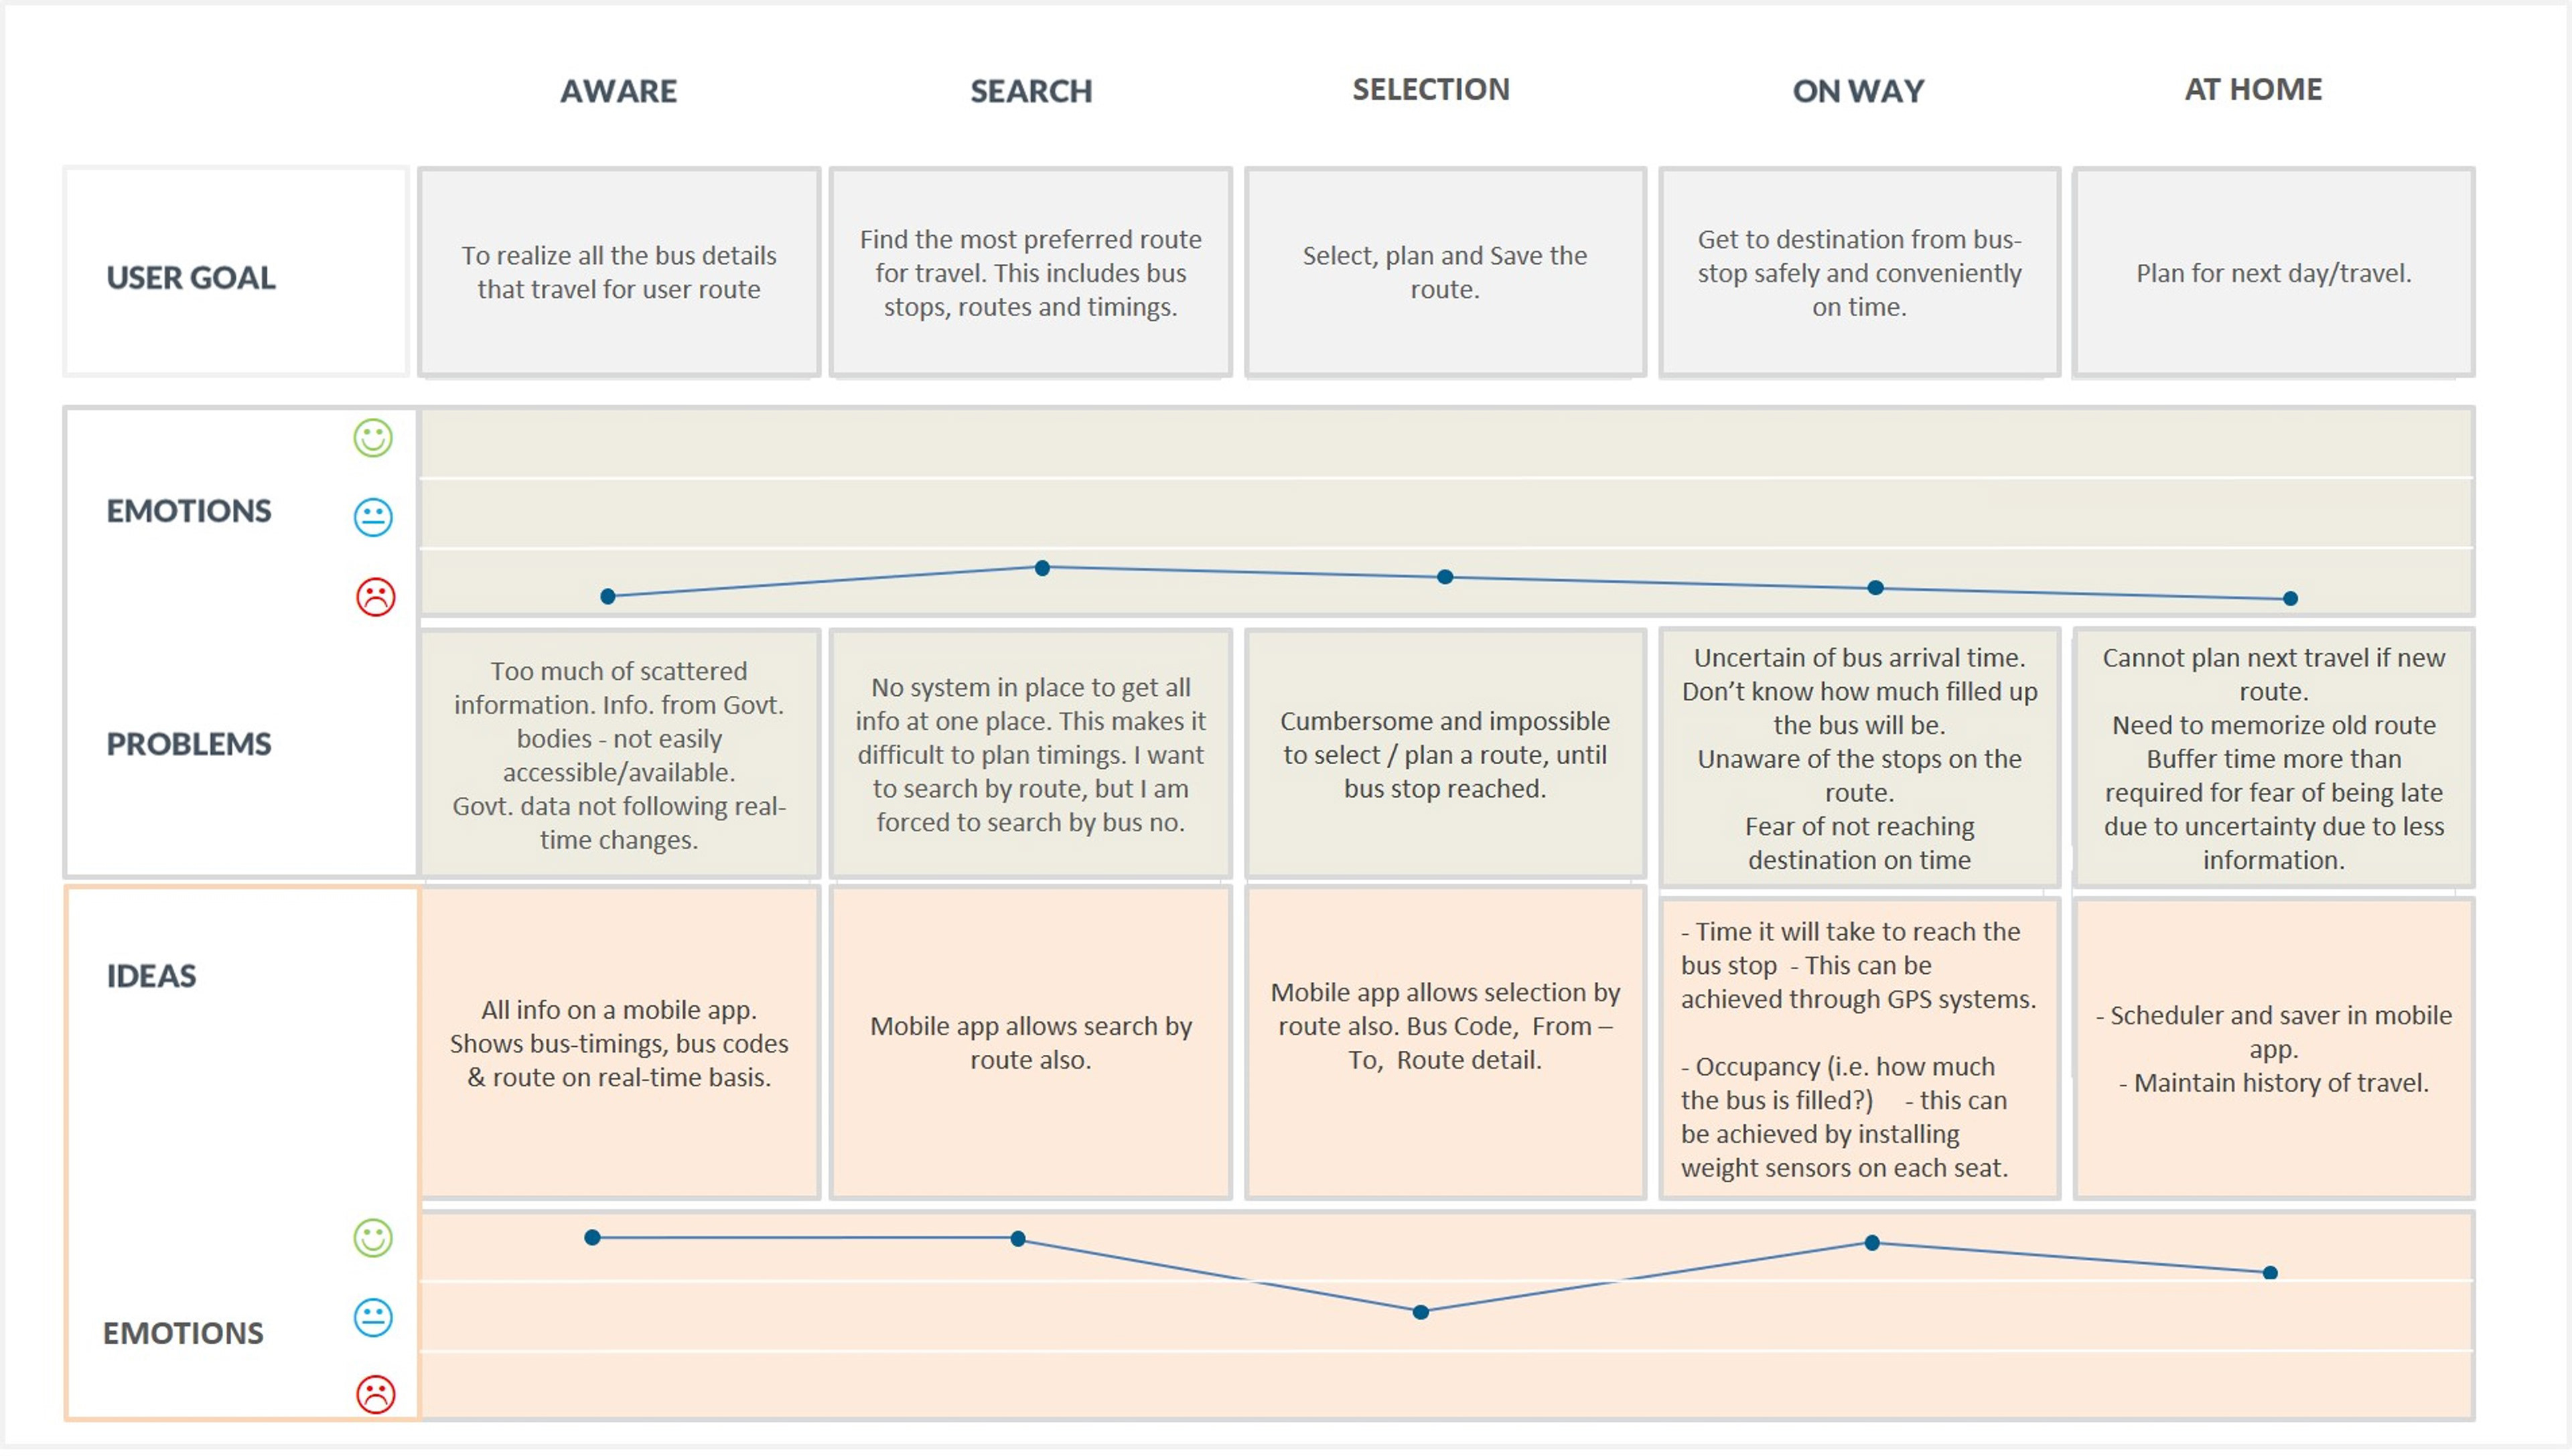
User Journey
I mapped out the users’ steps to see how I could simplify their journey to help them reach their most important goals with the product.
•During user research, we realized that there was an inter-dependence of context aspects that impacted decision making. User journey helped us understand that well.
•The most important user goal on the map was not transit from start point to end point, but it was the convenience of time, effort and certainty of travel from start point to end point.
•We determined the steps of the user journey through user research.
•While building user journey, it was realized that additional infra of GPS systems, on-site digital bus stop boards, was also required along with mobile app.

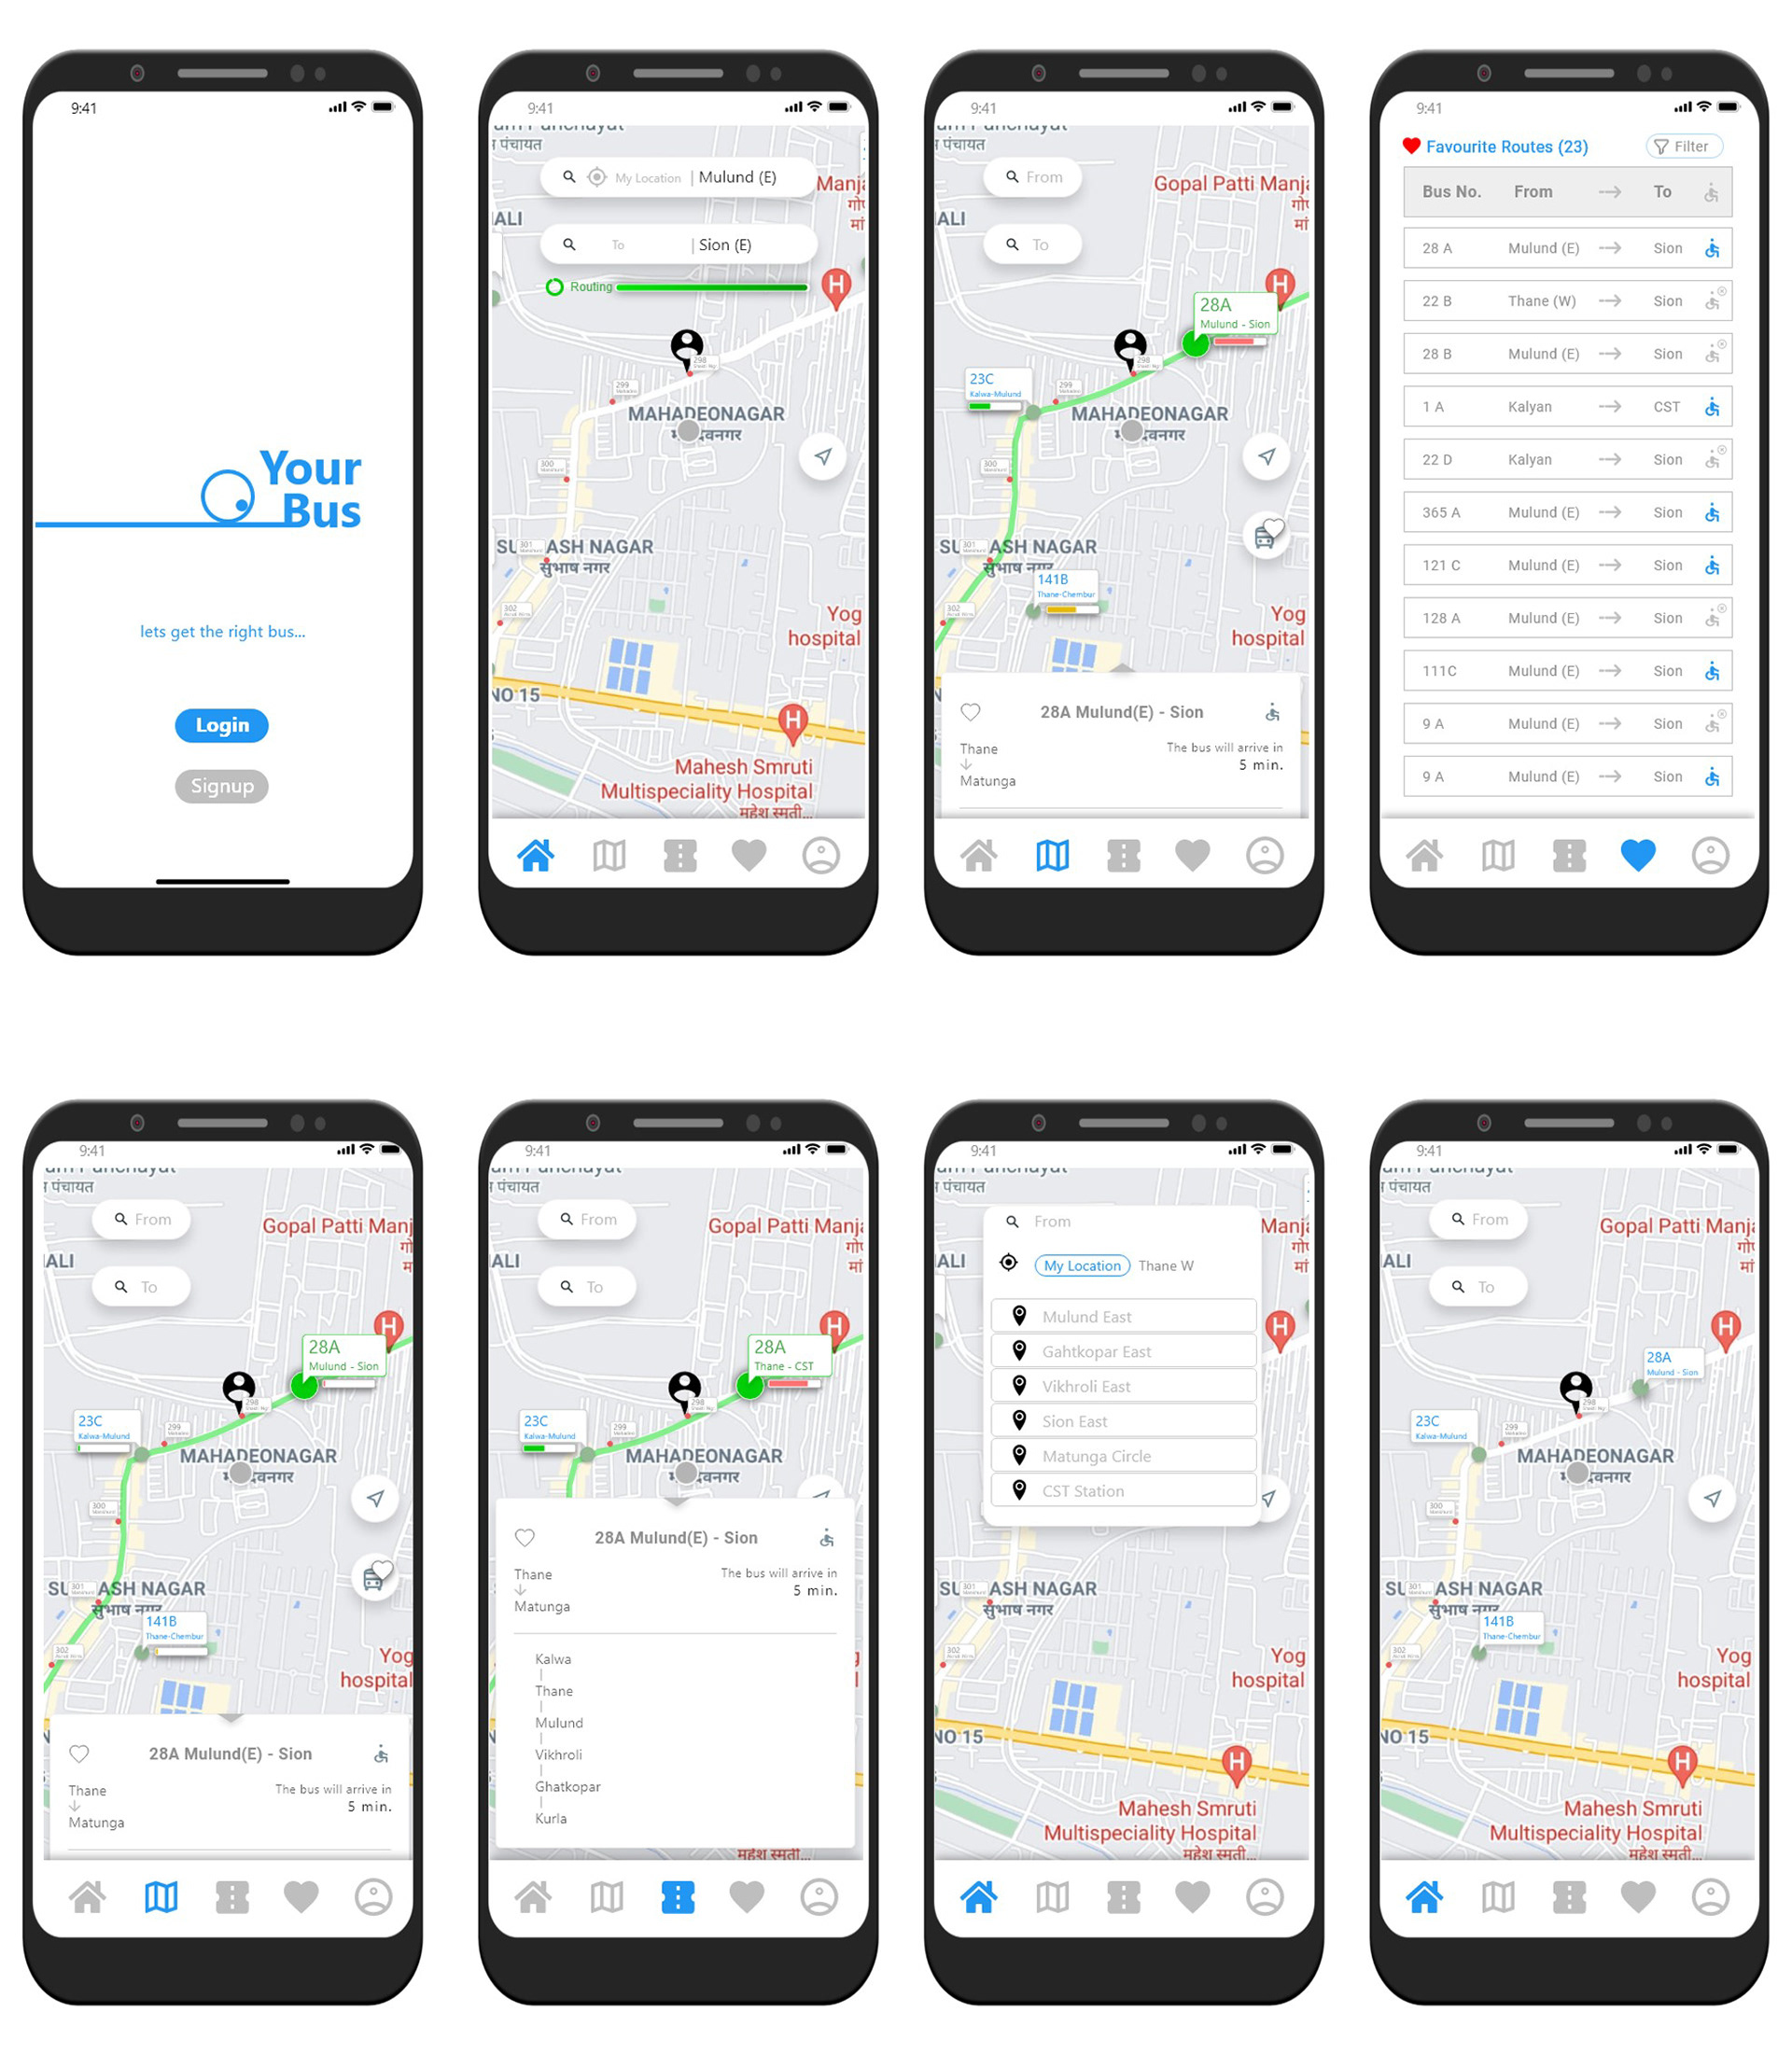
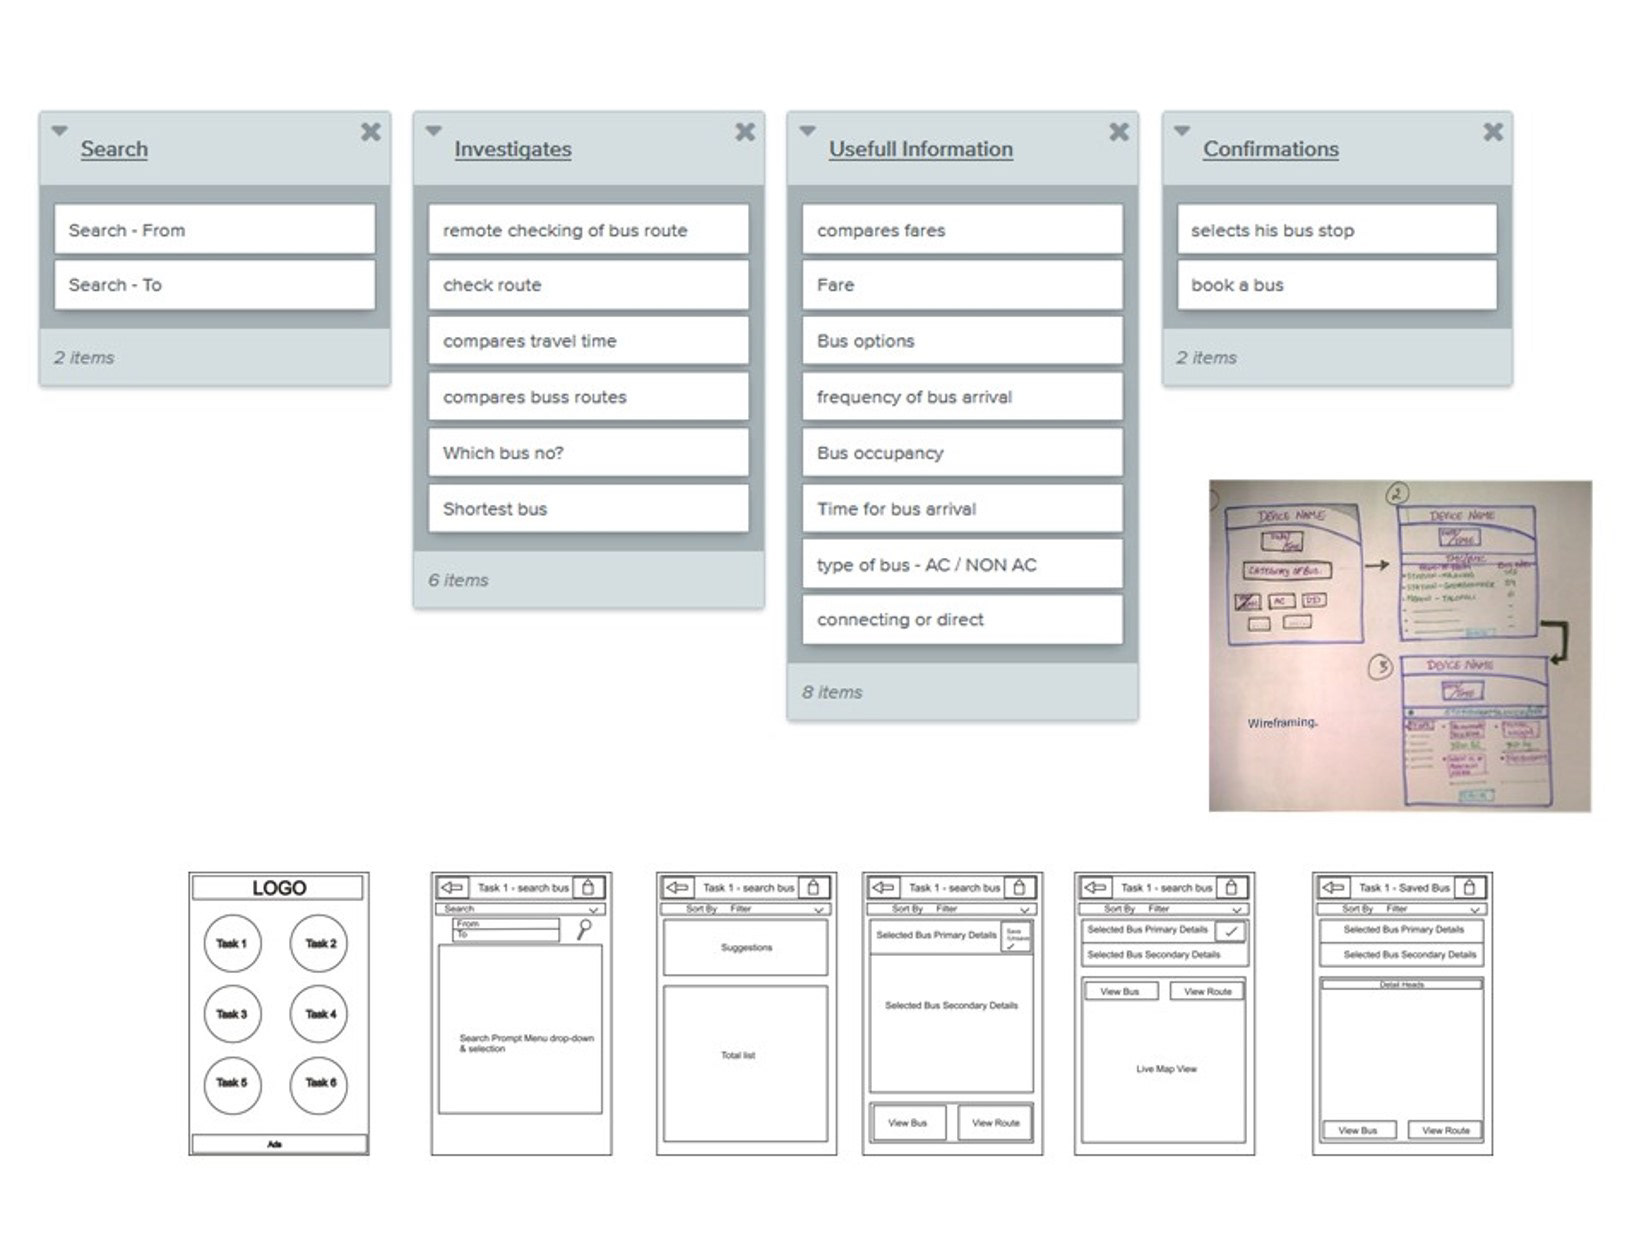
Data Sorting & Wire-framing
This process enabled easy grouping of data.
The wireframes were low fidelity type.
These were used as paper prototypes later to get a user feedback.
The landing home page consist of primary task features, i.e. nearby stops/buses, search a bus, booking a bus, bookmarks, scheduler and travel history .
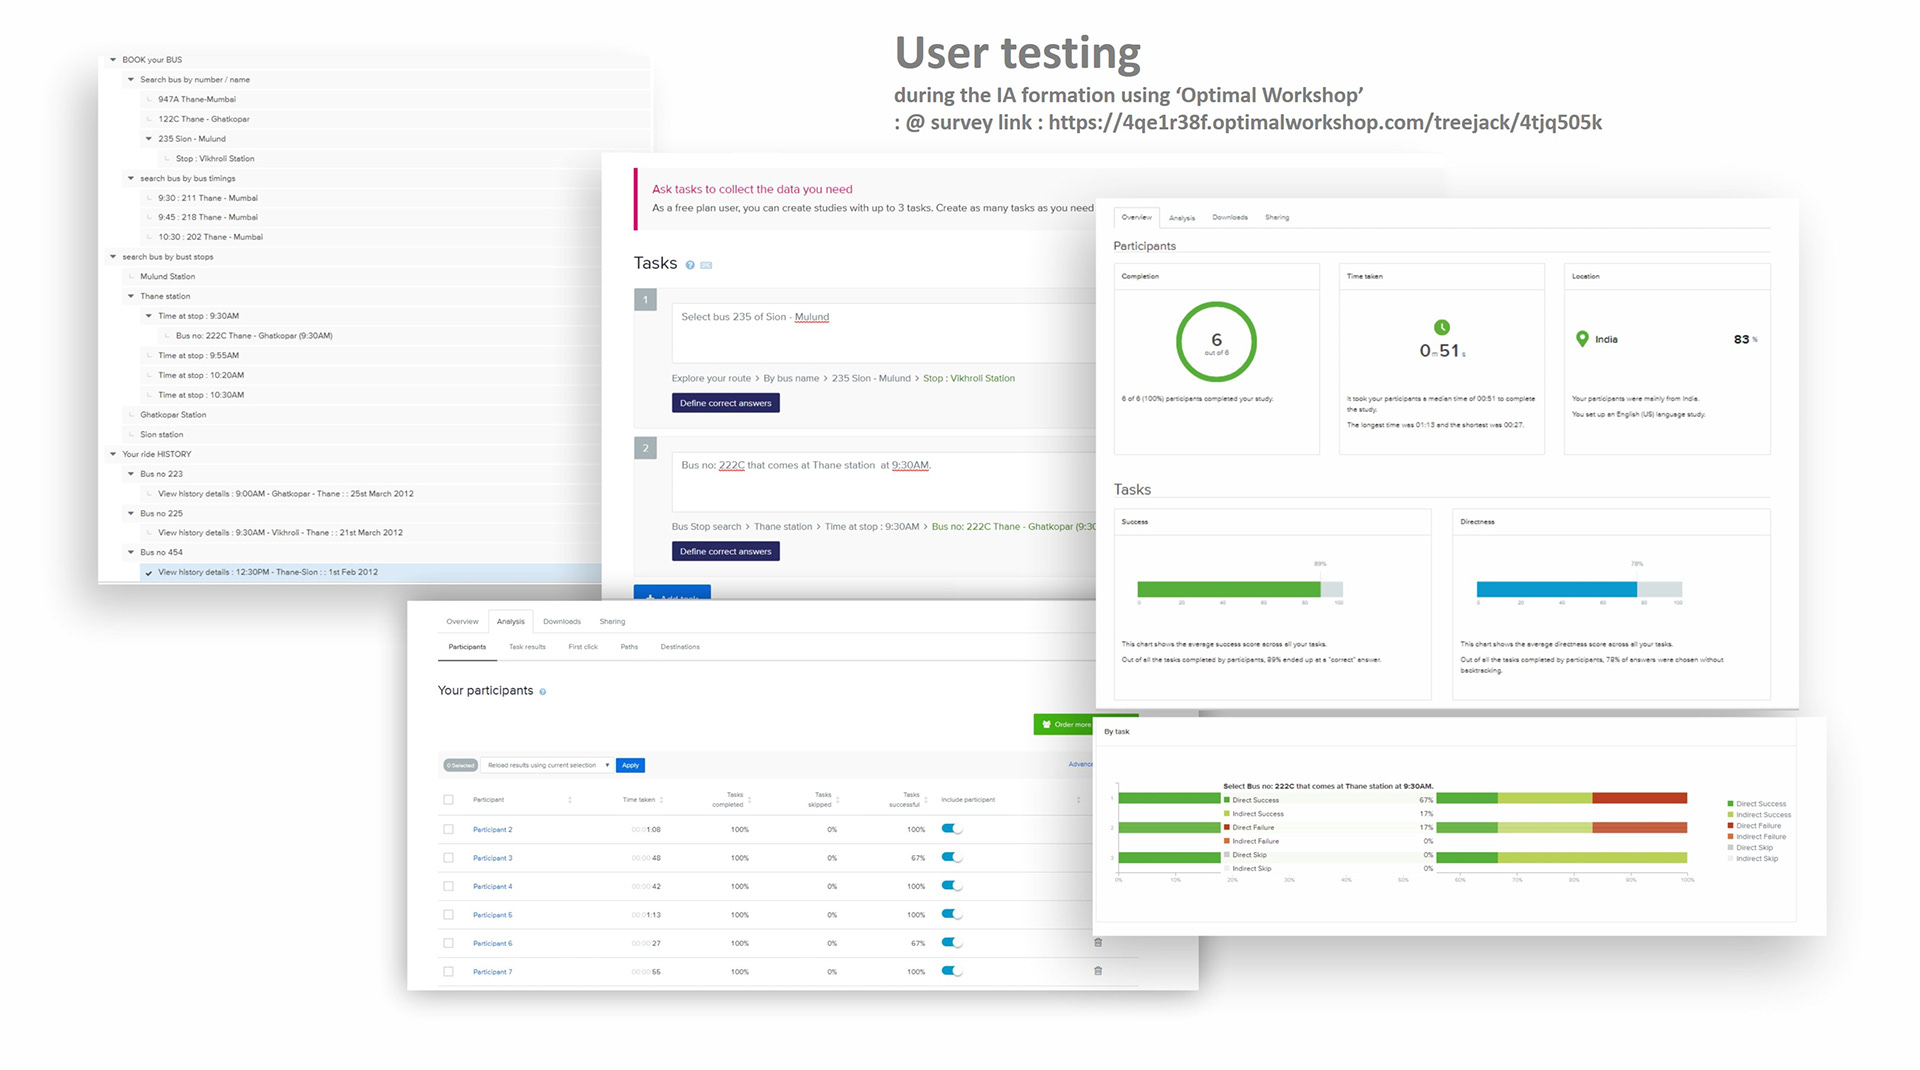
We conducted a small user testing during the IA formation using optimalworkshop.com
: @ survey link : https://4qe1r38f.optimalworkshop.com/treejack/4tjq505k

Existing Service V/S the New Solution
To understand how customers find the existing service V/S the new service, we created a Customer Journey Map.
• The user was exposed to high fidelity wire-frame for testing and feedback. In some cases, paper prints of the screen were also used.
• As soon as the user saw that all vital information was available at one space, the user realized the importance of this product & service.
• After using the service, the users believe that it will improve the quality of daily life and decrease unnecessary runabout stress. It will also help users optimize and plan more time in the day for themselves.
• The main pain areas for the customer journey in old scenario was uncertainty, unawareness of info, search & selection.
• Mapping customer journey also gave realization that the users planned their travel previous day. This led to a feature called scheduler and bookmark.
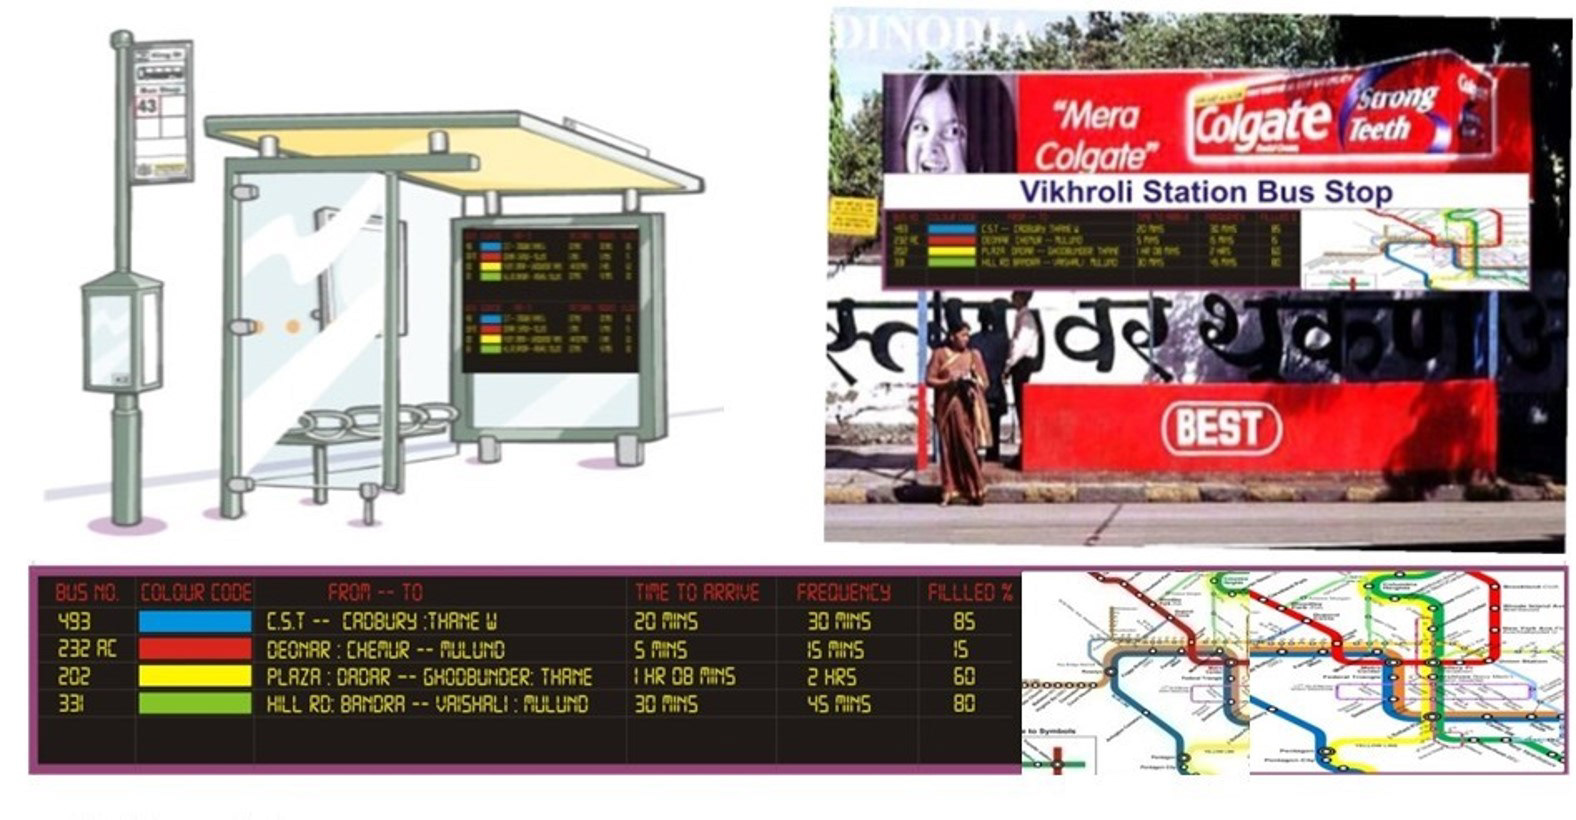
BUS BOARD DESIGN
The info provided on the buss stop board are: -Bus Code | From - To | Route detail | - this is achieved by colour coding the bus nos, and signifying on the corresponding printed route map. Frequency of bus Time it will take to reach the bus stop - This can be achieved through GPS systems. Occupancy (i.e. how much the bus is filled?) - this can be achieved by installing weight sensors on each seat.Color codes used for different routes on map.